The Geography of a Landed Cost: Why the Port of Entry Is a P&L Decision
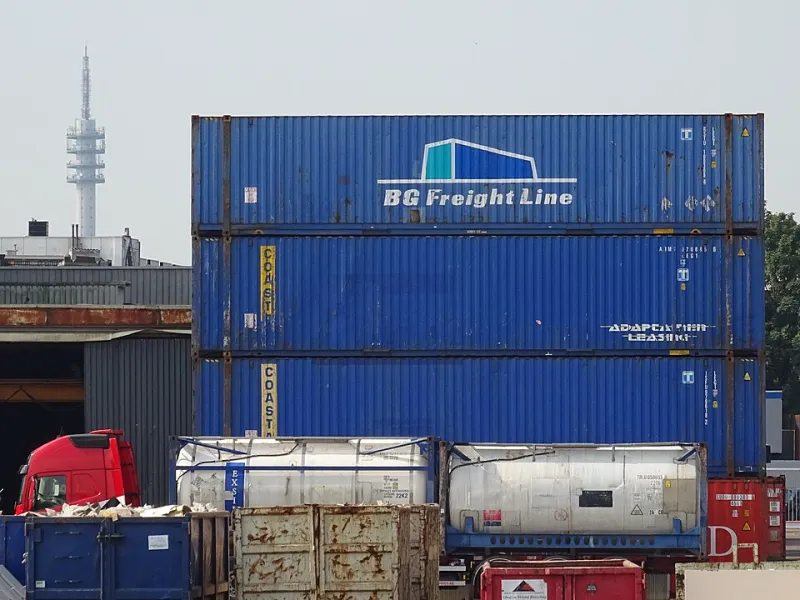
Photo: Nathan.cima, CC BY-SA 4.0, via Wikimedia Commons
Ask a room full of US importers how they chose their port of entry, and the honest answers rarely mention strategy. The freight forwarder used Long Beach because that's where the first shipment went in 2016. The Savannah routing came with an NVOCC that offered a favorable rate. Houston was chosen because a warehouse manager once lived in Texas. These are defaults, not decisions — and defaults have a price.
The price is embedded in a number every importer should know cold: the fully landed cost. Freight, duties, insurance, drayage, warehousing, and the cost of time all roll up into that figure. The port your goods clear through is not a line item on that list, but it influences nearly every line on it.
The Four Gateways That Move Most of America's Cargo
The United States is served by hundreds of ports, but a handful of gateways handle the overwhelming share of containerized imports. Understanding their structural differences is the first step toward making port selection a deliberate act.
Los Angeles and Long Beach together process more ocean-borne containers than any other US gateway. Their advantage is simple: Southern California is the largest consumer market in the country, and transcontinental rail connects the complex to the Midwest and beyond. The trade-offs are equally well documented — congestion during peak season, chassis shortages, and labor negotiations that periodically send shippers scrambling for alternatives.
Savannah has become the fastest-rising port on the East Coast, and its growth is no accident. The Port of New York and New Jersey remains the largest East Coast gateway, but Savannah pairs deep water, aggressive on-terminal rail with Norfolk Southern and CSX, and some of the shortest truck turn times in the nation. For importers serving the Southeast — a region that has absorbed a remarkable share of US population and manufacturing growth over the past decade — Savannah often wins on inland cost alone.
Houston plays a different game entirely. Its strength lies in energy, petrochemicals, and project cargo, but its container business has grown steadily, particularly for goods bound for Texas and the broader South-Central region. With no state income tax, expansive industrial real estate, and a growing distribution footprint, Houston rewards importers whose end customers sit within a day's drive.
Seattle-Tacoma and Oakland round out the West Coast picture, often trading volume share with the LA/Long Beach complex depending on labor conditions and carrier alliances.
Where the Hidden Costs Live
The ocean freight rate is the number everyone negotiates. It is rarely the number that determines who wins. Consider four cost drivers that vary meaningfully by port:
Dwell and demurrage exposure. A container that sits past its free time starts accruing charges that can exceed $150 per day. Ports with chronic congestion convert routine volume spikes into recurring fees. Importers who model demurrage as a probability-weighted cost, rather than an exception, often discover that a "more expensive" port with faster turns is cheaper in practice.
Drayage distance and trucking rates. The cost to move a container from the terminal to a warehouse in Dallas differs dramatically depending on whether it arrived in Long Beach (roughly 1,400 rail miles away, plus drayage at both ends) or Houston (about 260 miles by road). Intermodal economics favor one routing; door-to-door trucking can favor the other. The right answer depends on your volume, your equipment mix, and your transit-time tolerance.
Customs examination rates and processing speed. Some ports have higher targeting rates for certain commodity types, and exam facilities vary in how quickly they turn containers. A week spent in a CES (Centralized Examination Station) is a week your inventory isn't selling — and in seasonal categories, it can be the difference between a full-price season and a markdown.
Chassis and equipment availability. The American chassis model — where motor carriers typically supply their own equipment — creates friction points that vary by market. Ports with robust pooled chassis availability reduce the odds of a container missing its appointed pickup window.
Rerouting Without Ripping Up the Playbook
No importer should change gateways on a whim, and no serious operator reroutes live peak-season cargo based on a spreadsheet exercise. The disciplined approach looks different:
- Model total landed cost by gateway for your actual volumes, including drayage, intermodal, demurrage exposure, and inventory carrying costs — not just ocean rates.
- Run a controlled pilot. Shift 10–15% of volume to an alternative port for one quarter and measure actual costs and transit times, not quotes.
- Build optionality into contracts. Many service contracts allow port flexibility at the carrier's discretion; negotiate for flexibility at yours.
- Watch the policy calendar. East Coast port labor negotiations, West Coast contract cycles, and potential tariff structures on specific trade lanes can all reshuffle the math quickly. The importers who weathered recent disruptions best were the ones who had already qualified a second gateway.
A Decision Worth Making Deliberately
Port selection will never be the most glamorous decision in a supply chain. But the compounding effect is real: a routing that shaves three days of transit, cuts demurrage exposure in half, and trims inland freight by $200 per container changes the economics of every purchase order you place. At KROS International USA, we encourage our partners to revisit their gateway strategy annually — because the geography that served your business five years ago may be quietly taxing it today.